Advanced Chrome DevTools Features Every Developer Should Know
Written By  Idriss Douiri
4 min read

As web developers, mastering Chrome DevTools can significantly boost our productivity and debugging experience. In this comprehensive guide, we’ll explore some of the most powerful yet lesser-known Chrome DevTools features that can transform your development workflow.
What is Chrome DevTools?
Chrome Devtools is a set of tools built into Chromium-based browsers like Google Chrome, Edge, Brave, and more. These tools help web developers debug, edit, and perform other actions on the page faster.
How to Open Chrome DevTools?
Accessing the Chrome DevTools can be done in more than 5 ways, but these 2 methods are more than enough for now:
- Press right-click on any webpage, and select the “Inspect” option from the context menu.
- Use a shortcut like F12 or Ctrl+Shift+I (Windows/Linux) or Comd+Option+I(MacOS) to open your last used devTools panel.
Dollar Sign Selectors Shortcuts
Select Last Inspected Elements 4
The $0 through $4 selectors are the history of the last five inspected elements from the elements panel or JavaScript heap objects selected in the Profiles panel. Where $0 returns the last inspected element, and $1 returns the second last inspected element, and so on.
$0.classListSelect One Element with $()
No more long document.querySelector on your console, instead use the jQuery style, where $() works as document.querySelector which selects and returns the first element it finds.
$(".card").style.color = "white"The $() function also accepts an optional startNode parameter which specifies the scope in which the function will search, with the default value being the document.
$("button", $(".card"))Select Multiple Elements with $$()
similar to the $() function, the $$() works like document.querySelectorAll() and returns all the matching elements in an array.
$$(".link").forEach(el => el.classList.add("active"))Real-Time Debugging with Live Expressions
The Watch Live Expressions feature allows you to monitor JavaScript expressions in real-time as your application runs. This powerful tool helps you track changing values without adding console.log statements.
Setting Up Live Expressions
- Click the “Create Live Expression” button (eye icon) in the Console panel
- Enter your expression (e.g.,
document.activeElement) - Watch the value update in real-time as you interact with your page
- After you are done, remove the expression by clicking the close icon

Practical Use Cases
- Monitor viewport dimensions during responsive testing
- Track state changes in framework components
- Debug scroll positions and element dimensions
- Observe network request counts and timing
Computed Styles
The Computed tab in Chrome DevTools is an essential tool for debugging CSS and understanding how property values are calculated through inheritance. Located within the Elements panel, this powerful feature displays the final computed values of all CSS properties applied to the selected element.
By clicking the expandable arrow next to any property, you can trace the complete inheritance chain and see exactly where each value originates from. For quick navigation, clicking the linked file reference will instantly jump you to the corresponding rule in the Styles panel, making it effortless to modify the source styles.
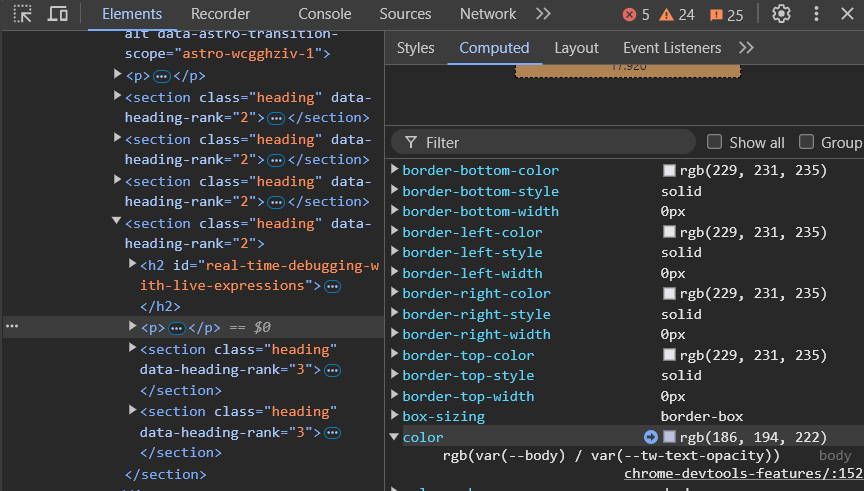
This tab is particularly valuable when dealing with complex CSS cascades or troubleshooting unexpected style behaviors.
Command Menu
The Command Menu makes performing DevTools functionality faster. Similar to VS Code’s command palette you can open it using the shortcut Ctrl+Shift+P (Windows / Linux) or Cmd+Shift+P (Mac) while the DevTools open.
Alternatively, you can open the command menu by clicking the 3 dots on the top right of the DevTools and select “Run command”
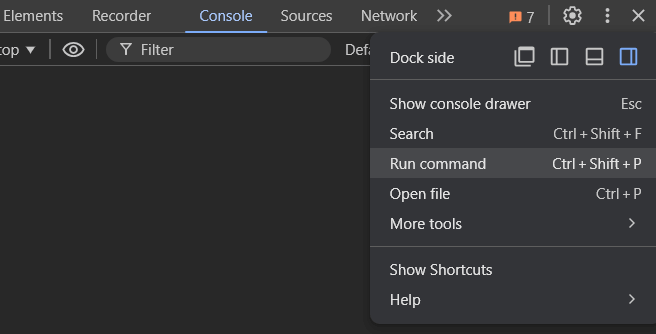
Some useful commands to run include:
- Taking screenshots on the page
- Toggling dark and light themes
- Disabling/Enabling JavaScript, and much more.
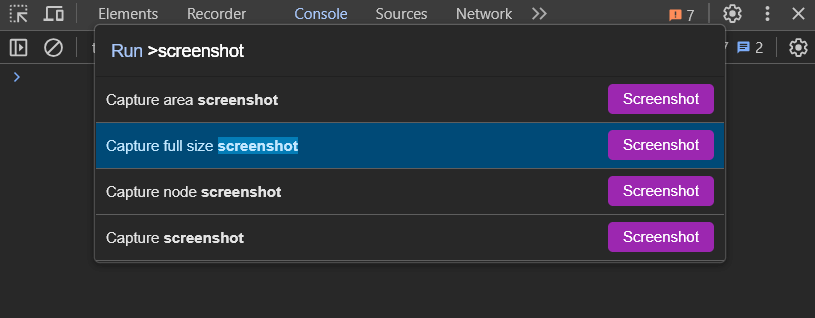
The command menu can be used for other tasks like opening files. Delete the greater than symbol > and type ? to see what else it can do.
Pretty Print
Pretty Print in Chrome DevTools transforms minified or compressed code into a readable, properly formatted version with just one click. Located in the Sources panel, this essential feature is activated by clicking the curly braces icon {} at the bottom of any source file.
When working with production JavaScript, CSS, or HTML files that have been minified to reduce file size, Pretty Print automatically adds proper indentation, line breaks, and spacing, making the code significantly easier to debug and understand.
Lighthouse
Lighthouse is Google’s automated website auditing tool integrated directly into Chrome DevTools, providing comprehensive insights into your web application’s health and performance. By analyzing five critical aspects—Performance, Accessibility, Best Practices, Progressive Web App (PWA) capabilities, and Search Engine Optimization (SEO)—Lighthouse generates detailed reports with actionable metrics and recommendations. Each audit produces a score from 0-100, accompanied by specific opportunities for improvement and step-by-step guidance to resolve identified issues.
To run an audit, simply open DevTools, navigate to the Lighthouse panel, select your desired audit categories, and choose between mobile or desktop device simulation.
